
The Struggle for Global Influence in the United Nations General Assembly
How China, Russia, and the U.S. compete for power in the UN's consultative body.

Dear reader,
I come back to this newsletter after some time off. I won’t discuss this matter in public; let me just say that it is a great thing to be here. I am glad to announce my comeback to the Italian press scene with an article on the European Parliament (behind paywall).
In this episode, I will delve into the inner workings of the UNGA, one month after the extraordinary session of the United Nations General Assembly. It shows how a new world is emerging and how much of the storytelling about the omnipotent U.S. or West is little more than a myth.
Thanks for reading.
BRUSSELS, Belgium – The General Assembly of the United Nations is the tribune where the most pressing issues the International Community faces are debated. This sort of global parliament debates resolutions and tries (without the possibility of enforcement) to steer world affairs. True, the real power in the UN lies in the Security Council. This sort of board of directors represents reality after World War II, gathering those who, in theory, are the main shareholders of the world, having defeated the Axis powers in 1945.
Eighty years after its foundation, the United Nations faces an existential crisis: the events in Ukraine, the Middle East, Sudan, etc., show its lack of power and prestige. Yet, data from the United Nations General Assembly (UNGA, for brevity) can help us understand a little bit of the state of international relations, particularly answering one single and fundamental question: who is in charge here? The following chart offers some hints.
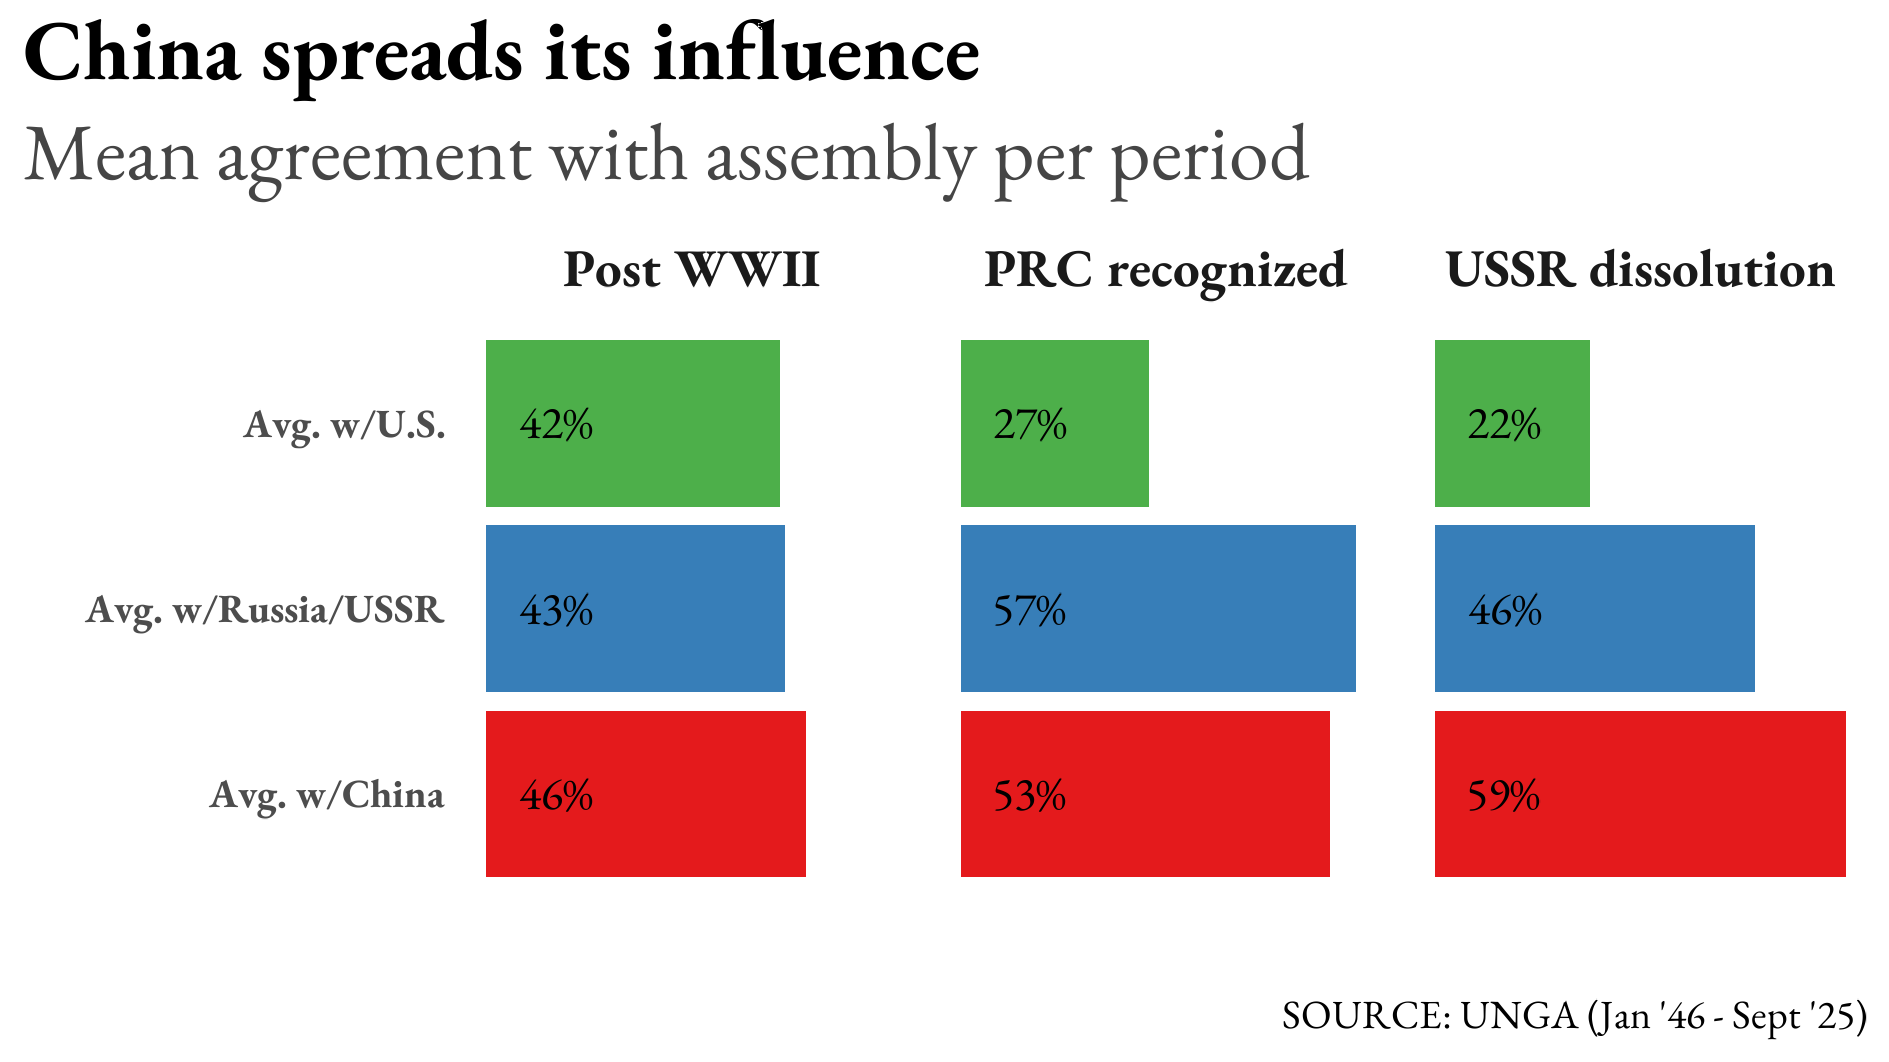
The chart above shows how, on average, the UNGA agrees with China, the U.S., and Russia. China, the U.S., and Russia are now the top three countries in the world. Despite not being able to win in Ukraine, Russia still has the largest nuclear arsenal in the world; China is a superpower, by size if anything, adding, recently, weaponry and wealth to an already substantial chunk of the global population; The U.S. portrays itself as the most powerful country in the world after winning the Cold War.
The chart above shows how the United States is losing grip on the UNGA in favor of China. The periodization is not arbitrary. Communist China was not part of the U.N. Charter at the end of WWII: Taiwan was. The entry of Beijing-China in the United Nations in 1971 represented a tectonic shift in the history of the institution.
Russia, on the other hand, kept a strong grip on the UNGA, losing only 11 percentage points after the dissolution of the Soviet Union. The U.S., though, wielded the same influence as the USSR in the aftermath of WWII. With the process of decolonization and the end of the Cold War, the United States found itself somewhat cornered in the UNGA.
A few charts will shed light on this.
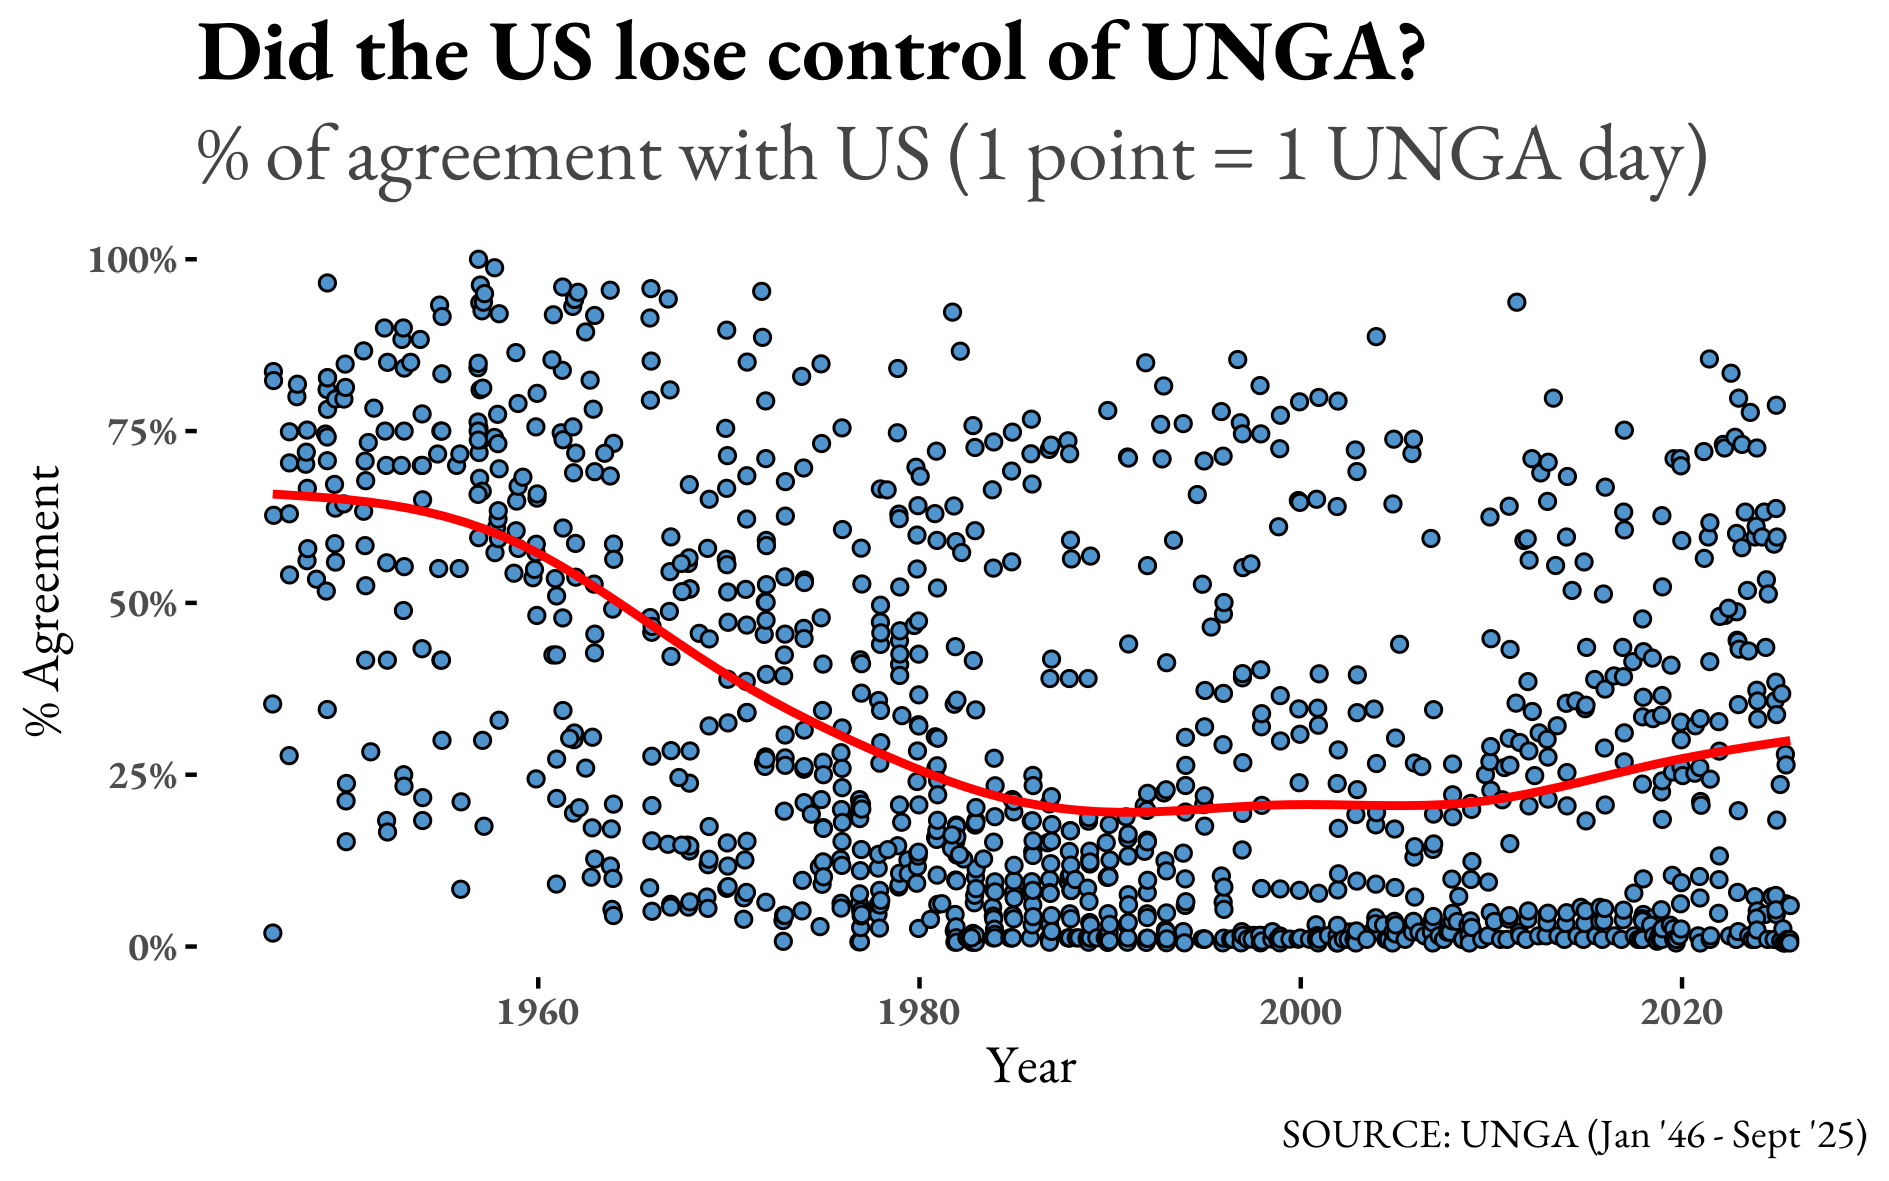
Here, we see the agreement with the U.S. daily (one point equals one day) in the UNGA. Essentially, DaNumbers calculated how many countries voted like the U.S. on each day the Assembly had votes and calculated the share it matches the U.S.
The smoother (the red line) highlights how the U.S. lost the influence it had. In particular, the days when the U.S. was not very popular populate a large area of the bottom-right corner of the chart, leaving the suspicion that America doesn’t have a lot of grip on the UNGA. The following chart will help a little more with that.
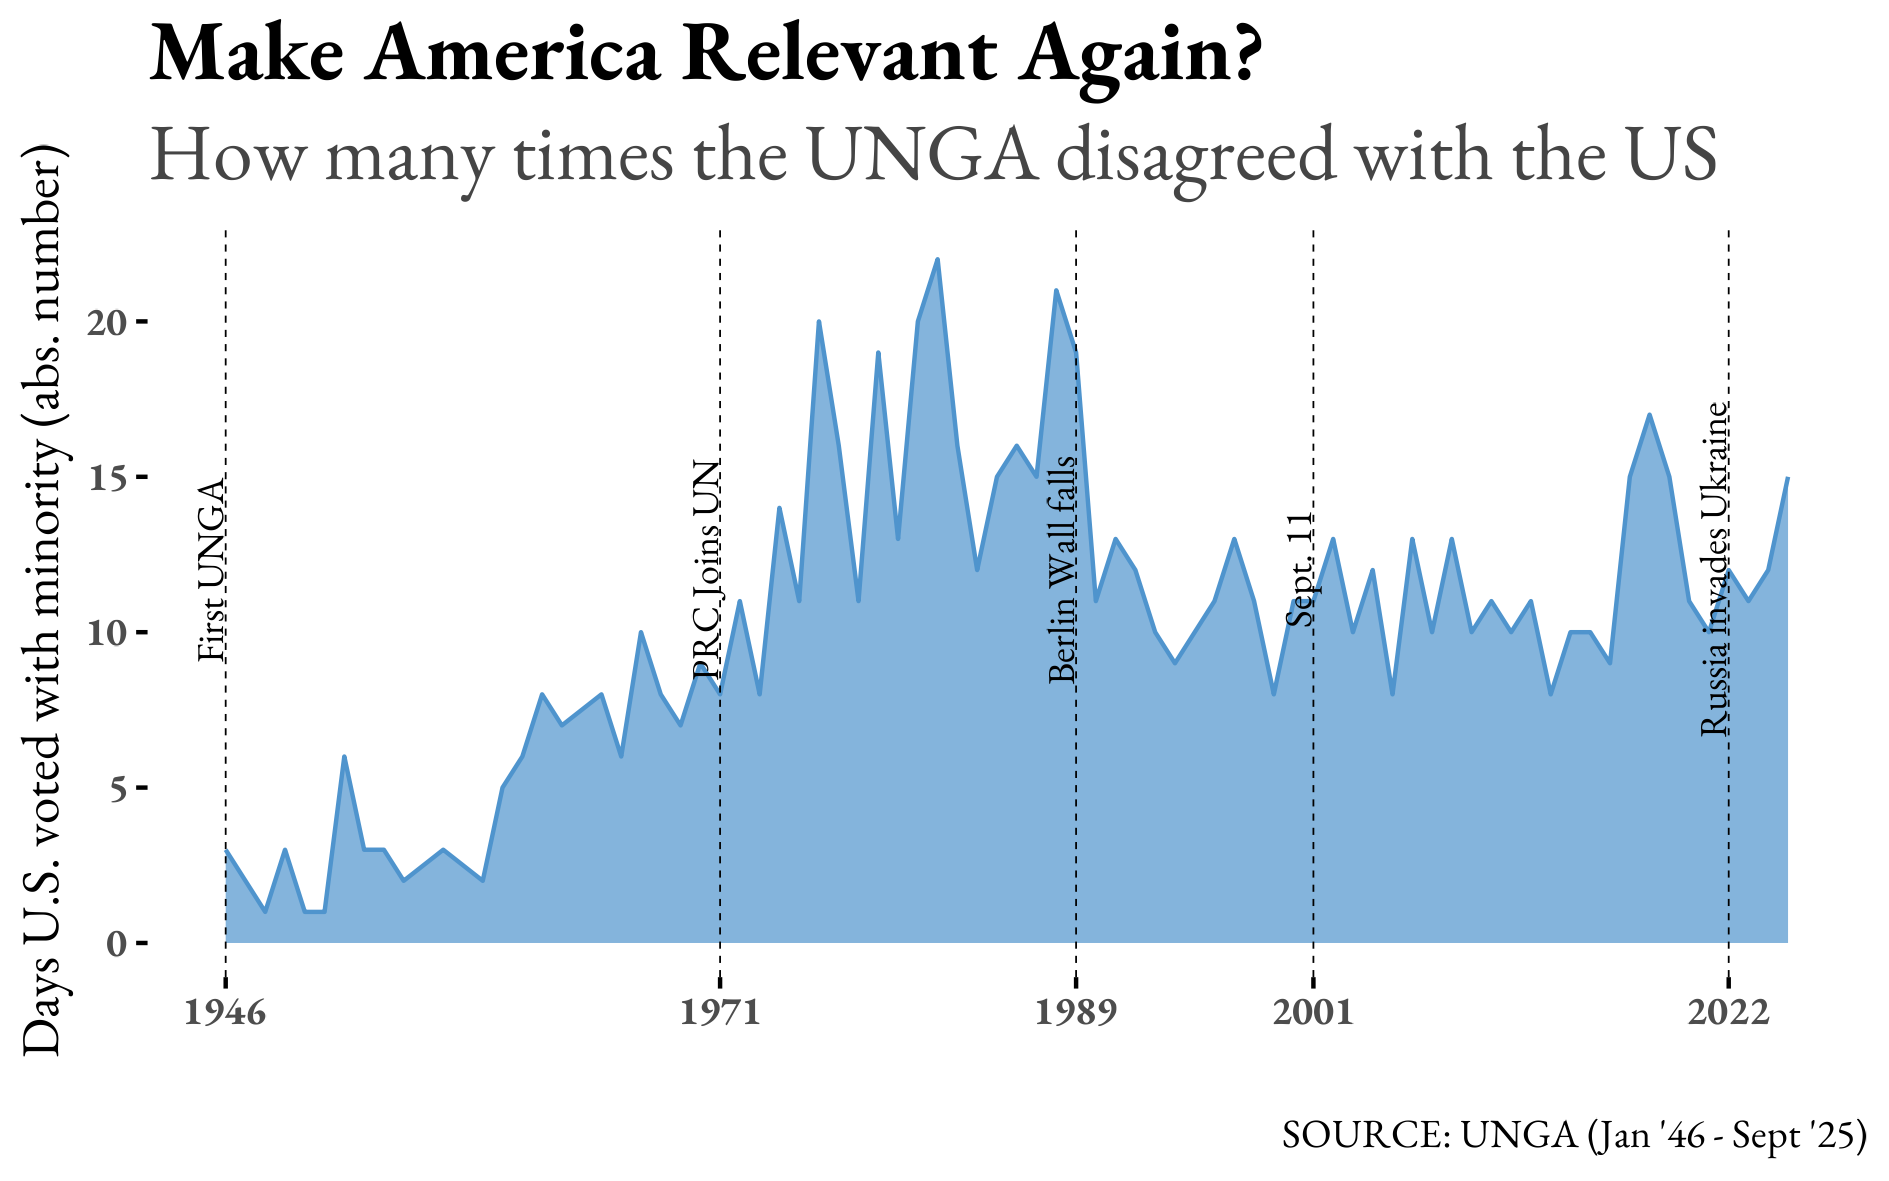
Here, DaNumbers calculated how many days the U.S. stood with the minority in the UNGA. We can appreciate how, after the PRC joined the UN and after the Vietnam War, America found itself cornered. It gained influence at the end of the Cold War and in the vicinity of the Russian aggression against Ukraine, but it lost influence again in the aftermath of the U.S. support to Israel for its own warfare against the Gazans.
The use of days in absolute terms is not a bug: it is a feature because it allows tracking the activity of the U.S. in the assembly, and it allows us to start showing some characteristics of the UNGA and its functioning. Moreover, given the functioning of the UNGA, it offers a clearer visualization of trends in the UNGA. For a better understanding of the General Assembly’s inner workings, the next chart offers a more nuanced picture.
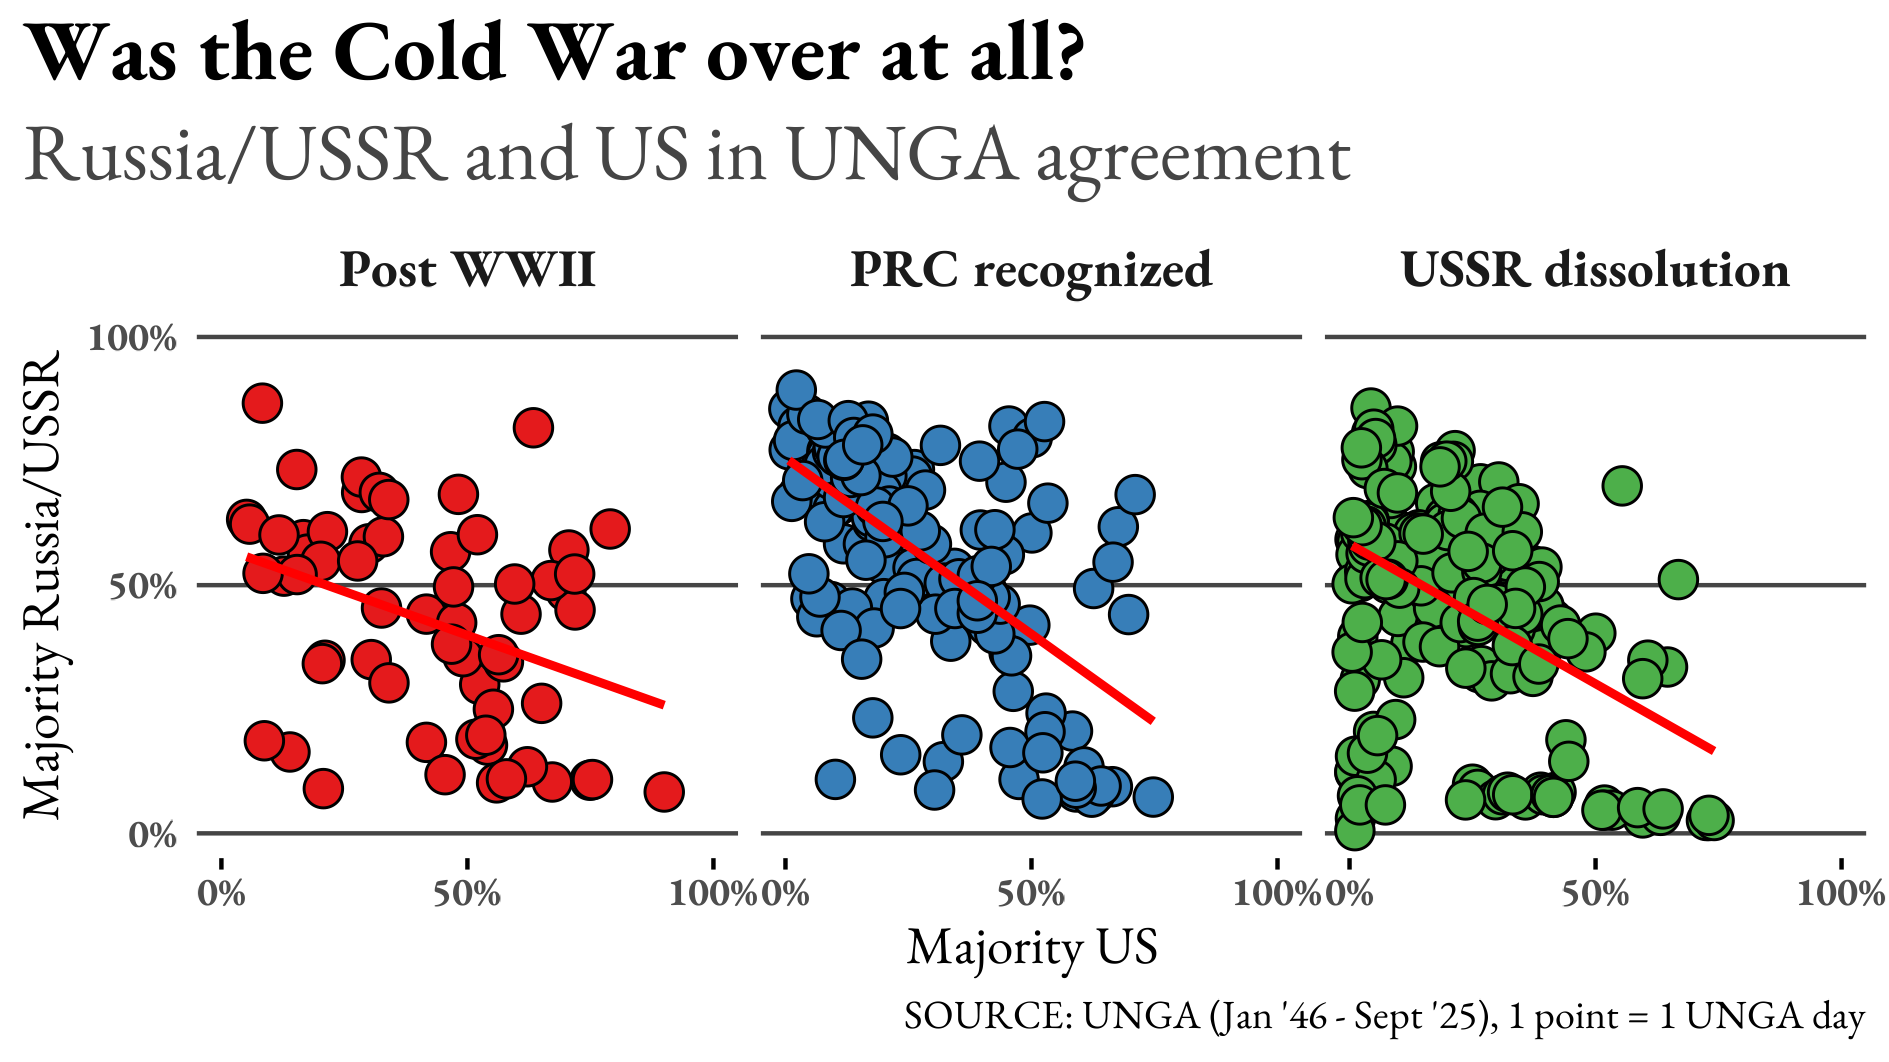
Here we see that in days when the U.S. represented a majority, Russia or the USSR was a minority. This transforms the UNGA in its nature: it is not a forum for discussion; it is a playground for a zero-sum role game. It was not necessarily the case during the Cold War, but back then, the UN was small, and, for a period, it suffered a boycott by the USSR.
The starting point of the red trend line in the third panel shows that, after the fall of the Soviet Union, the UNGA, in theory, looked more cooperative than after 1971. Although there is some truth in this proposition, the fact is that the more the assembly agrees with the U.S., the less it votes with Russia or the USSR, leading to a zero-sum game in the assembly where any U.S. gain is a Russian/Soviet loss.
If we analyze the behavior of individual states in the Assembly, this becomes even more evident.
Here, DaNumbers compared the mean agreement between the U.S. and Russia/USSR over the three periods taken into consideration. In the first panel, the country that agreed with everything is a very young Qatar with very few votes to calculate. In the second and third panels, we actually see that the UNGA is a zero-sum game.
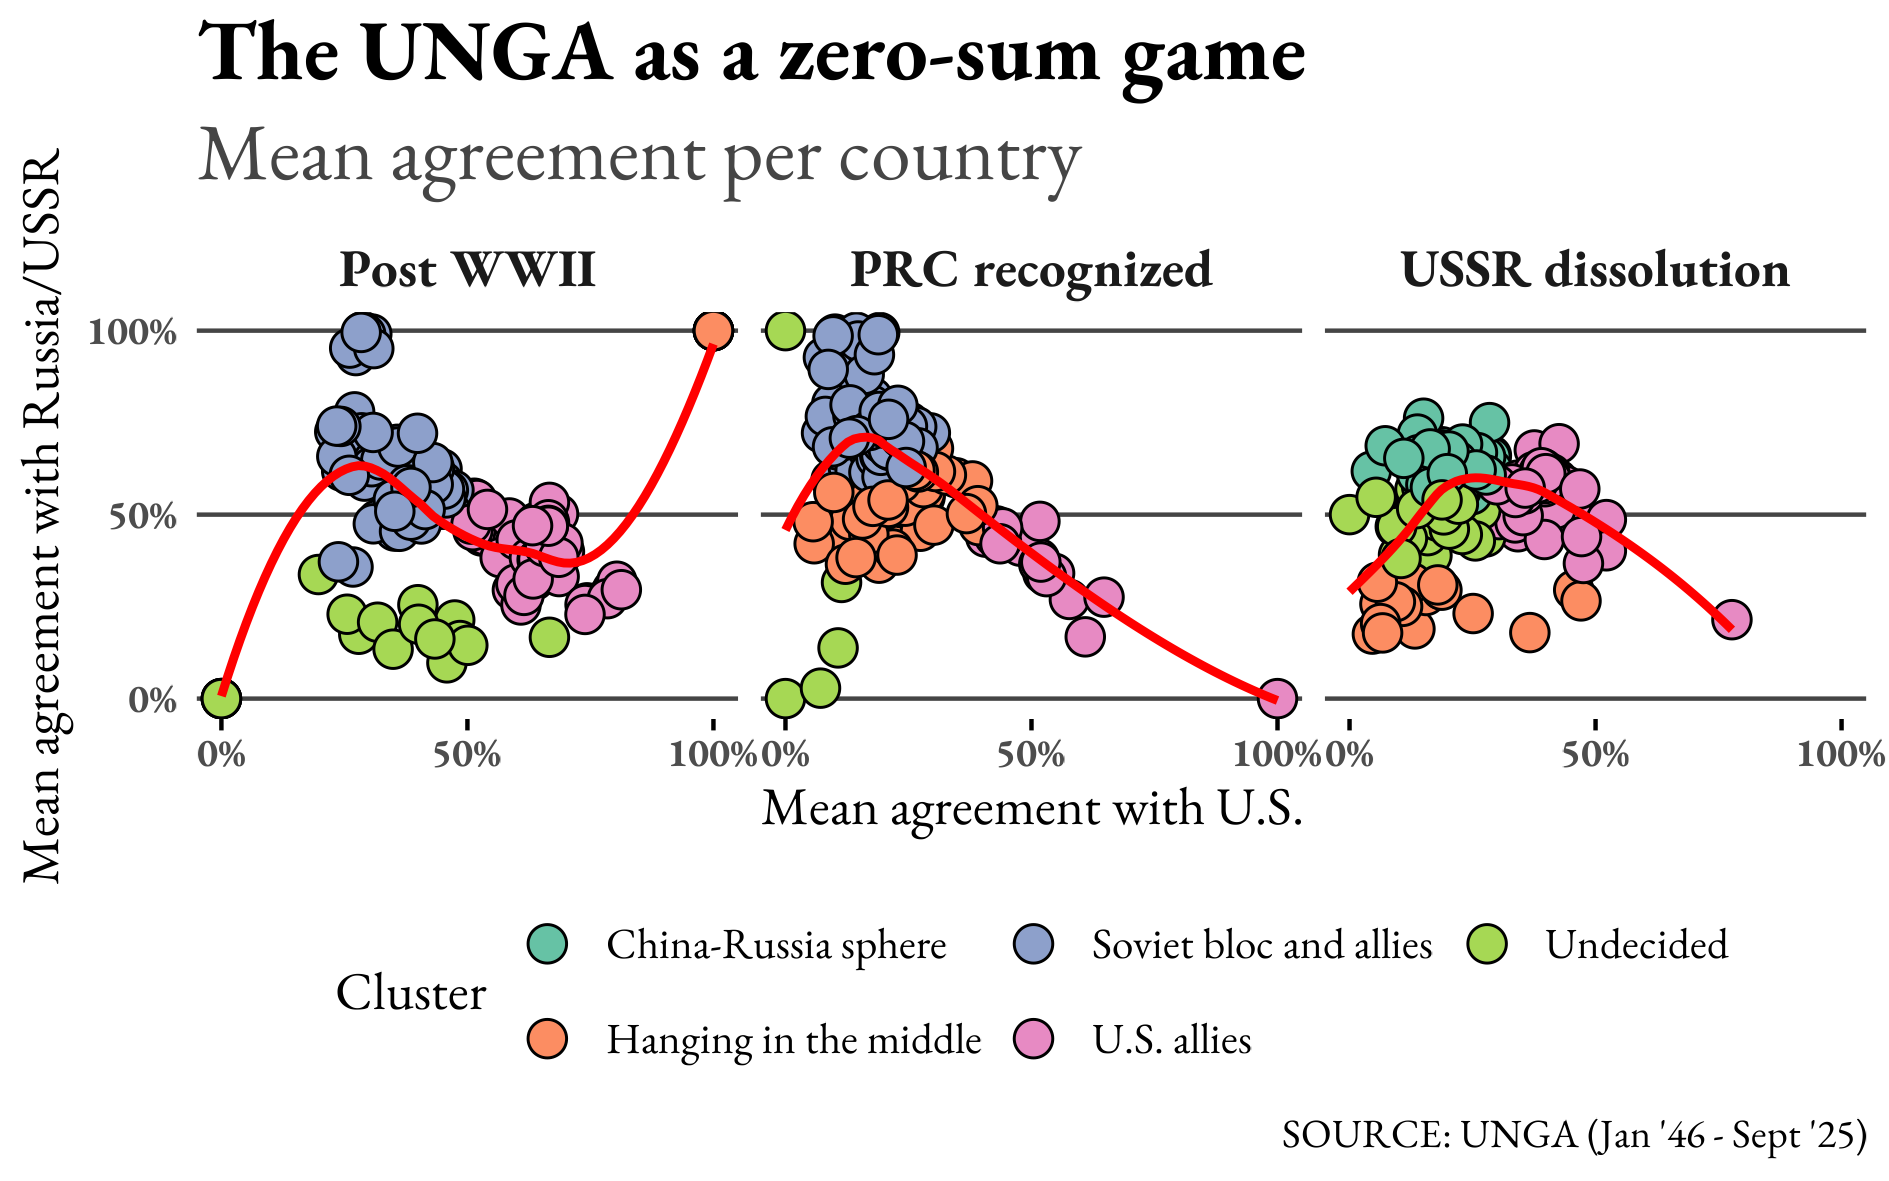
The smoother (the red curved line) shows something interesting between the third and the second panel: within a certain threshold, the data suggests that there is some cooperation between the countries with a less polarized UNGA. It seems, though that those charts show how different countries adopt different strategies in the UNGA.
The colors are very important because they highlight the alliances in the General Assembly. Our KNN clustering was very precise in reflecting reality. Particularly, the cluster called ‘Hanging in the middle’ represents small countries like Palau or St. Kitts and Navies, whereas the Undecided are generally former colonies of Western empires. Some of these countries, like Algeria, are considered part of the Soviet sphere of influence, though. The consequences of this are for the last paragraph.
In this chart, also, we also show the emergence of a Sino-Russian bloc that the algorithm spotted. The following chart will show this new bloc better.
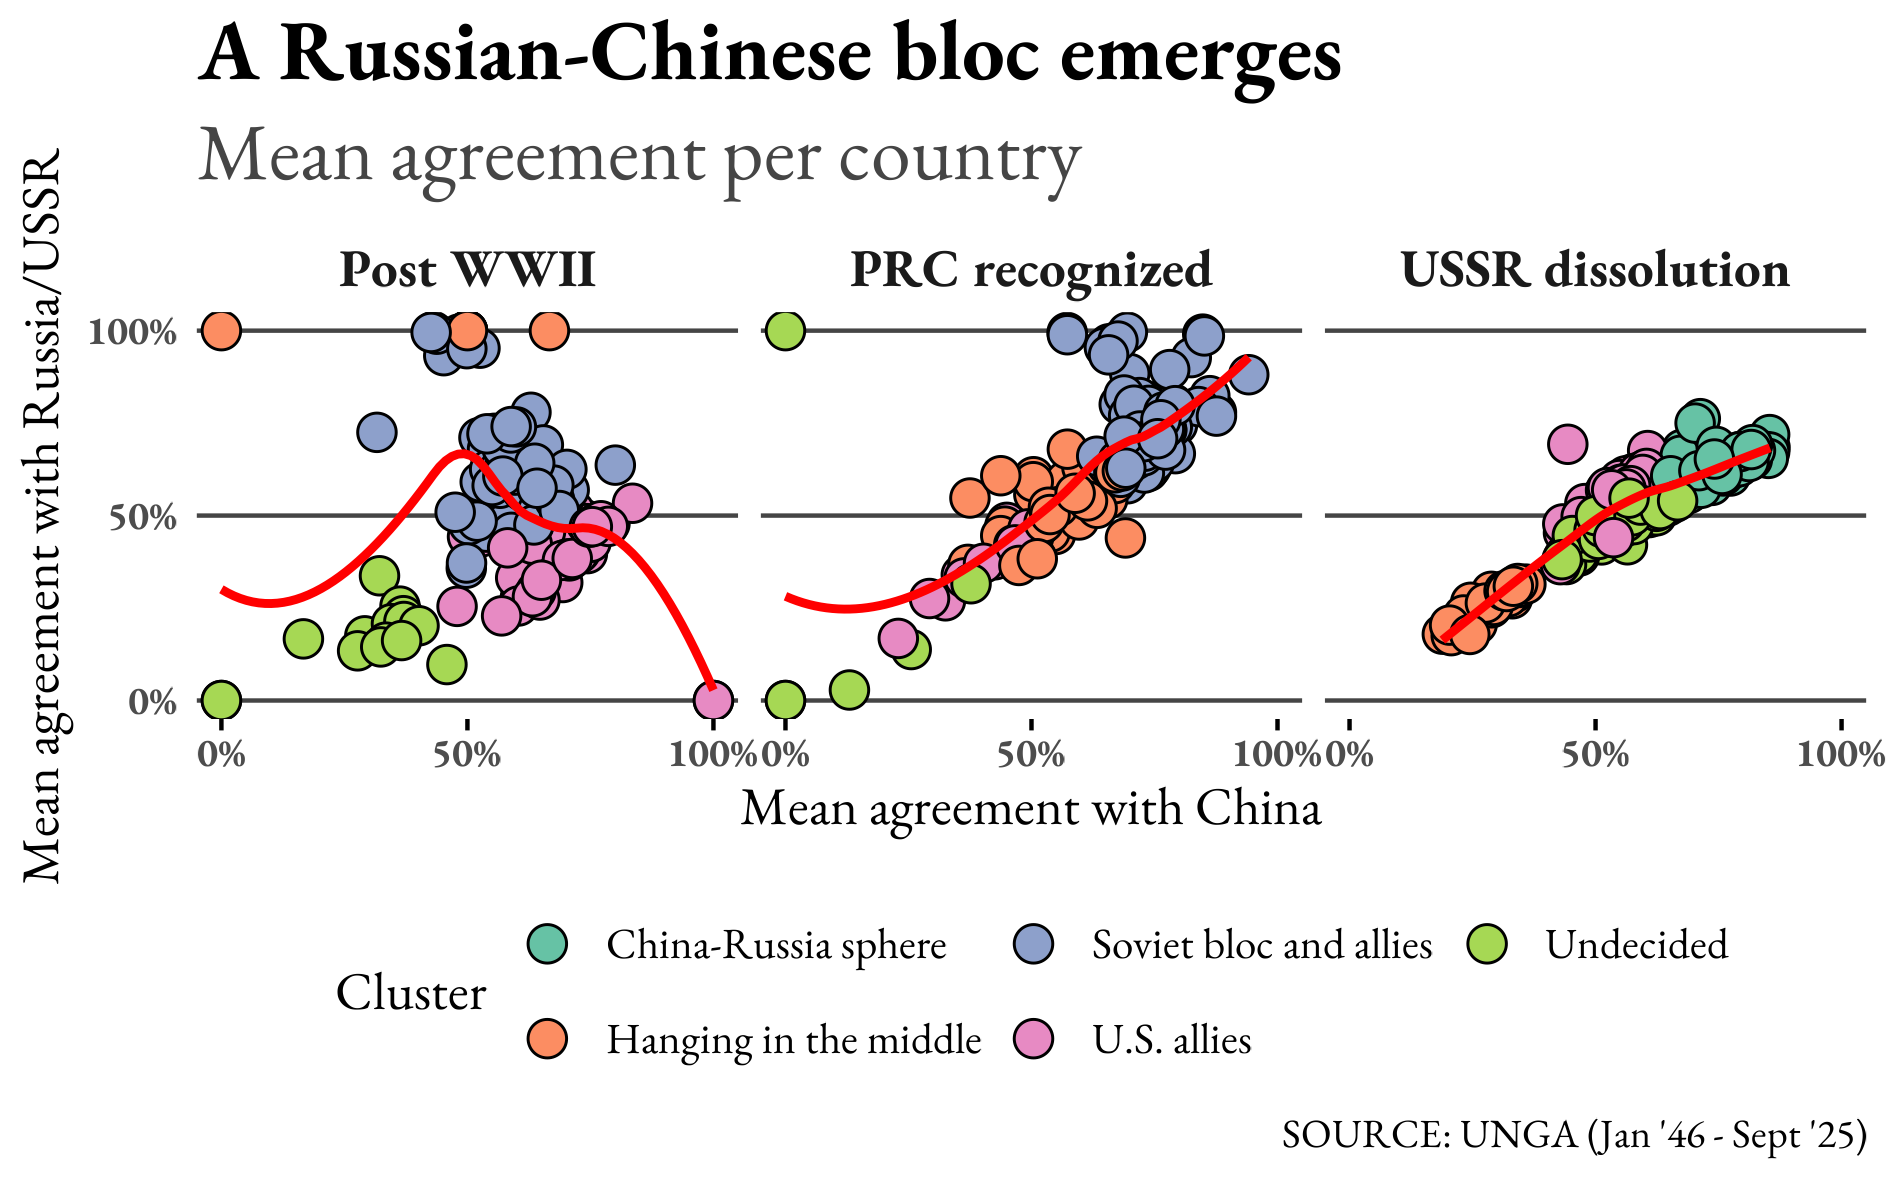
Comparing the alignment to Russia and China, we see how progressively these two countries approached each other. Now, the mean agreement with China is an excellent parameter to predict if a country will vote like Russia, for example. The major novelty this chart offers, though, is the substantial indecisiveness of the Western bloc. The ‘Hanging in the middle’ countries are more detached, but historical allies of the U.S. somehow fit in the new power dynamics that China seems to have started after the dissolution of the Soviet Union. The following chart will offer some further insights.
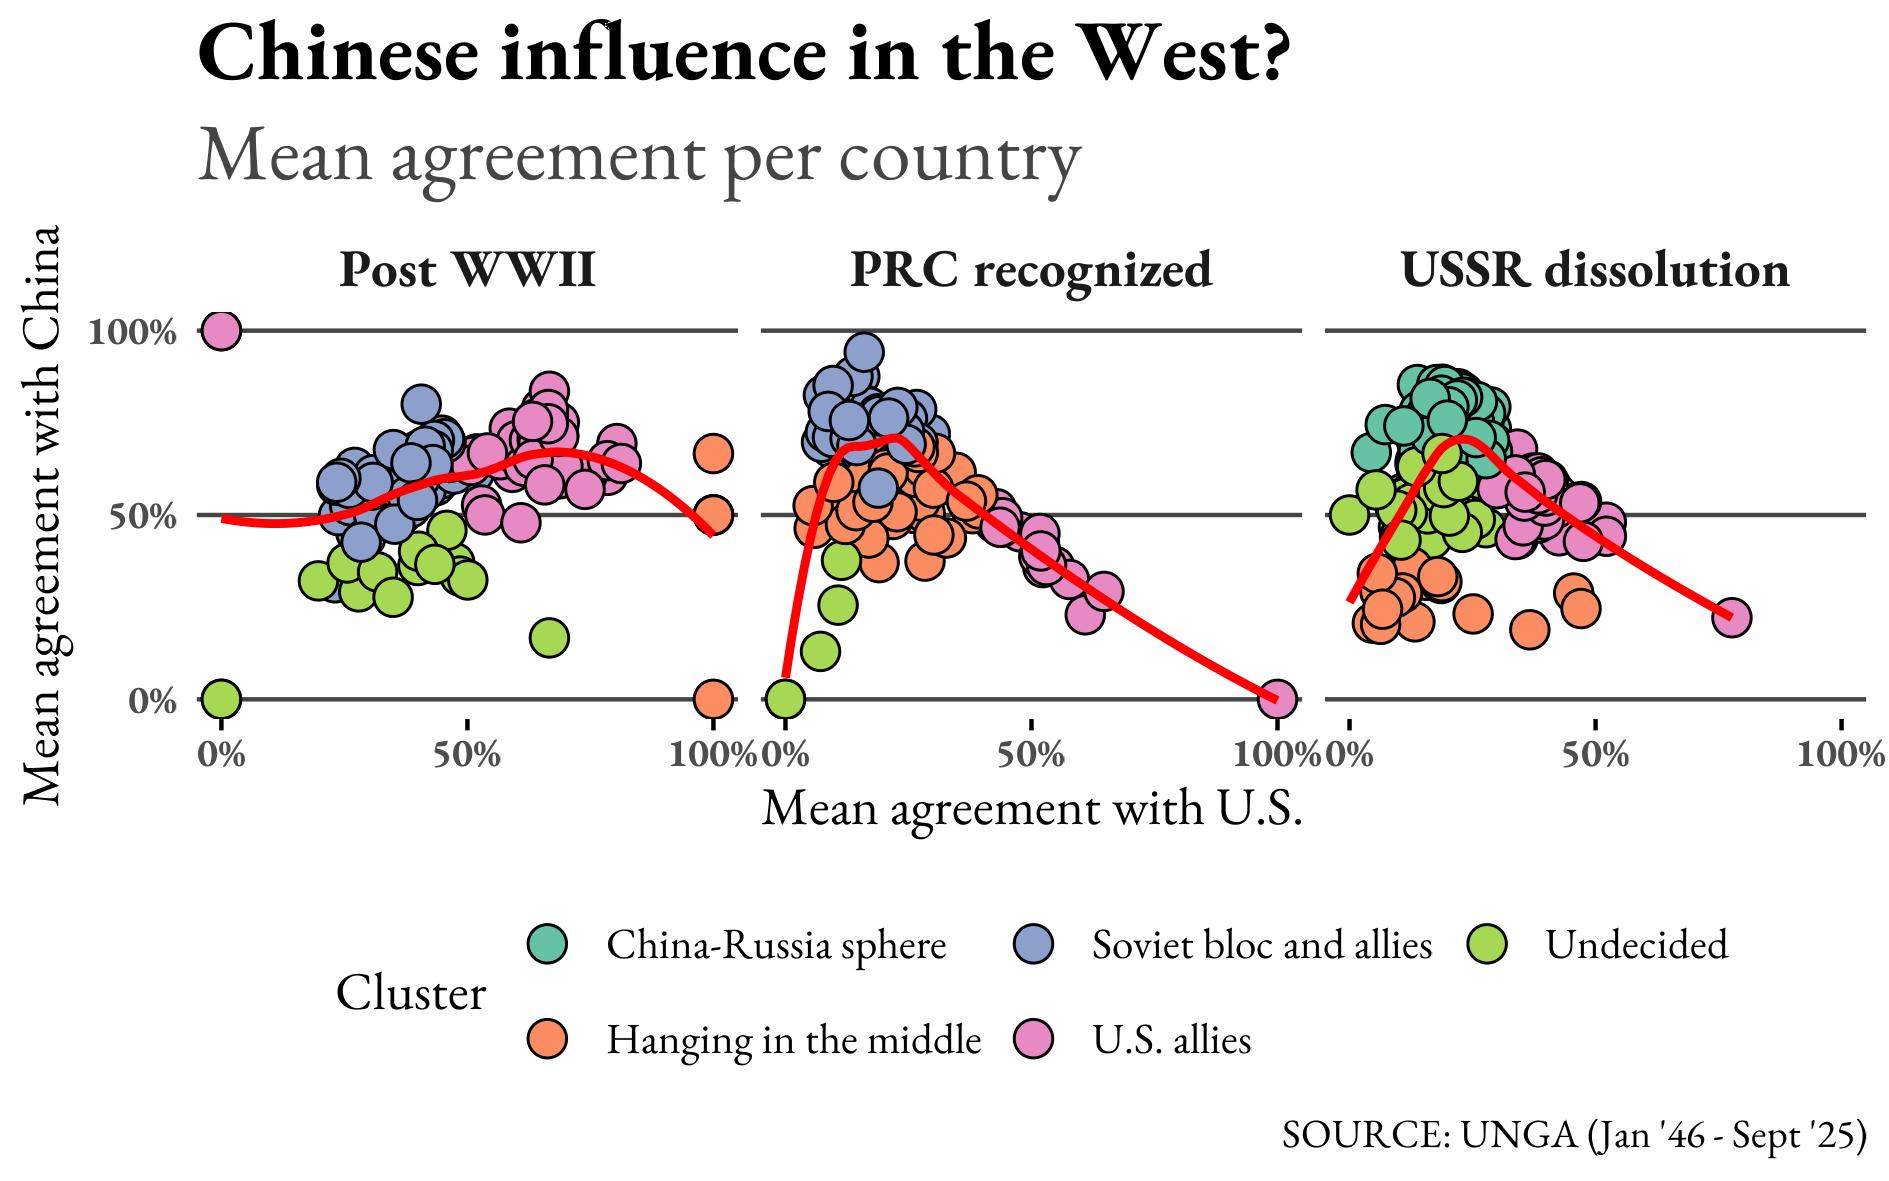
Here we need to focus on the third panel. Here, we see how (apart from Israel) Western countries, and traditional U.S. allies, do not agree more than 50% with the U.S., essentially proving how the Western bloc is not as cohesive as it might look in practice. In this sense, the comparison with the second panel is appalling: U.S. allies were above 50% of agreement with the United States and very little with China; things changed in the third panel.
In general, this chart is the confirmation of what we saw earlier: there is a bloc of countries aligned with Russia and China, with the rest of the world (including traditional U.S. allies) in the middle, trying to figure out what to do. The growth of the power of China since the end of the Cold War is evident; yet there is solid evidence of the influence crisis the United States faces in the United Nations General Assembly: in the real world, it is another pair of hands.