Is the world heading to World War III? It's complicated
A data-driven assessment of our danse macabre on the edge of the abyss.
Dear readers,
From a technical point of view, this episode couldn't be easier: data already prepared and cleaned, ready to visualize. The real problem here is that it tries to find an answer to a daunting question everyone I know has asked themselves since February 24: is WWIII (and its nuclear holocaust) coming? The answer I found is that WWIII is near but not imminent. Why? DaNumbers answers.
On a personal note, on September 6, I will be a guest of Richard Harris at an English-Speaking aperitivo in Grosseto, Italy. See you at 7 p.m. at Las palmas express if you are in the area (click here for the details). We will talk about data, data, and (again) data.
BRUSSELS -- February 24 might not have already gained the status of a symbolic date like September 11 or November 9; yet, data suggest that it was a major turnaround in global history. The disruptions it caused are perceived on a global scale. Moreover, on top of the Russian invasion, now we have a new frontline in this quirk quasi-cold/actual war being fought at the moment: Taiwan. China claims ownership of the island, the Taiwanese and their American allies do not agree, and recent visits by U.S. lawmakers didn't help solve the long-standing issue.
This is compounded by what happened after 2019. The world is still coping with COVID-19. Although restrictions remain residual in most countries, people keep dying. Reports stressed that COVID was the most common cause of death in Flanders, the Northern, Dutch-speaking region of Belgium, in 2020. Despite COVID not being politicized in the international arena, it remarkably impacted collective wellbeing.
Also, the Northern Hemisphere experienced harsh heatwaves and droughts. The Rhine river's level was so low that there were doubts if freighter barges could still float. The consequences of climate change are now more evident than ever. Although it is difficult to fit temperature increases into global politics, it is worth factoring climate into the equation.
The Bulletin of Atomic Scientists published the last update to its Doomsday Clock in January 2022. The Albert Einstein-founded publication estimates that we are 100 seconds away from the end of the world, factoring in the defense policies of the U.S., China, and Russia. Ten years ago, doomsday was a comfortable five minutes away. What do those 100 seconds mean? Using a vast array of datasets, DaNumbers tries to find an answer from three pillars: defense policies, economics, and politics.
How two world wars started
The chronologies of WWI and WWII are clear: the murder of an Austrian Arch-Duke and the invasion of Poland. What is difficult to understand is why world conflicts start in the first place. The New Palgrave Dictionary of Economics (2008) indicates two factors: naval arms races and the collapse of global trade. DaNumbers will investigate both in the following charts.
Here we see the different defense expenses of two major naval powers between 1900 and 1945 relative to GDP. The chart shows a military expense threshold under which a global confrontation likely starts: four percent. Whenever the British or American defense budgets got under the four-percent point of the GDP, prolonged periods of instability started, leading to global confrontations.
The chart shows only the point of view of the U.S. and the U.K., missing data from Germany and France. Moreover, the interpretation of this chart could lead to a too deterministic approach to global conflicts: four percent is not some sort of magic threshold, it is just one of the many factors that could lead to a world war, like the collapse of trade.
Trade data for anything before 1960 are difficult to gather for countries outside of the U.K. and the U.S. Yet, data about the two countries can offer insights into the context in which World Wars explode, as the following chart will show.
WWI saw inflation soar only after 1915 in Britain and the United States. What appears to have forced the U.S. to intervene in 1917 is a strong inflation spiral that ended with the end of the conflict. Regarding WWII, the problem of the 1930s economy was a strong deflationary push after the crisis of 1929. That led to a re-routing of global trade, which led, ultimately, to war, according to The New Palgrave Dictionary of Economics. Is that enough?
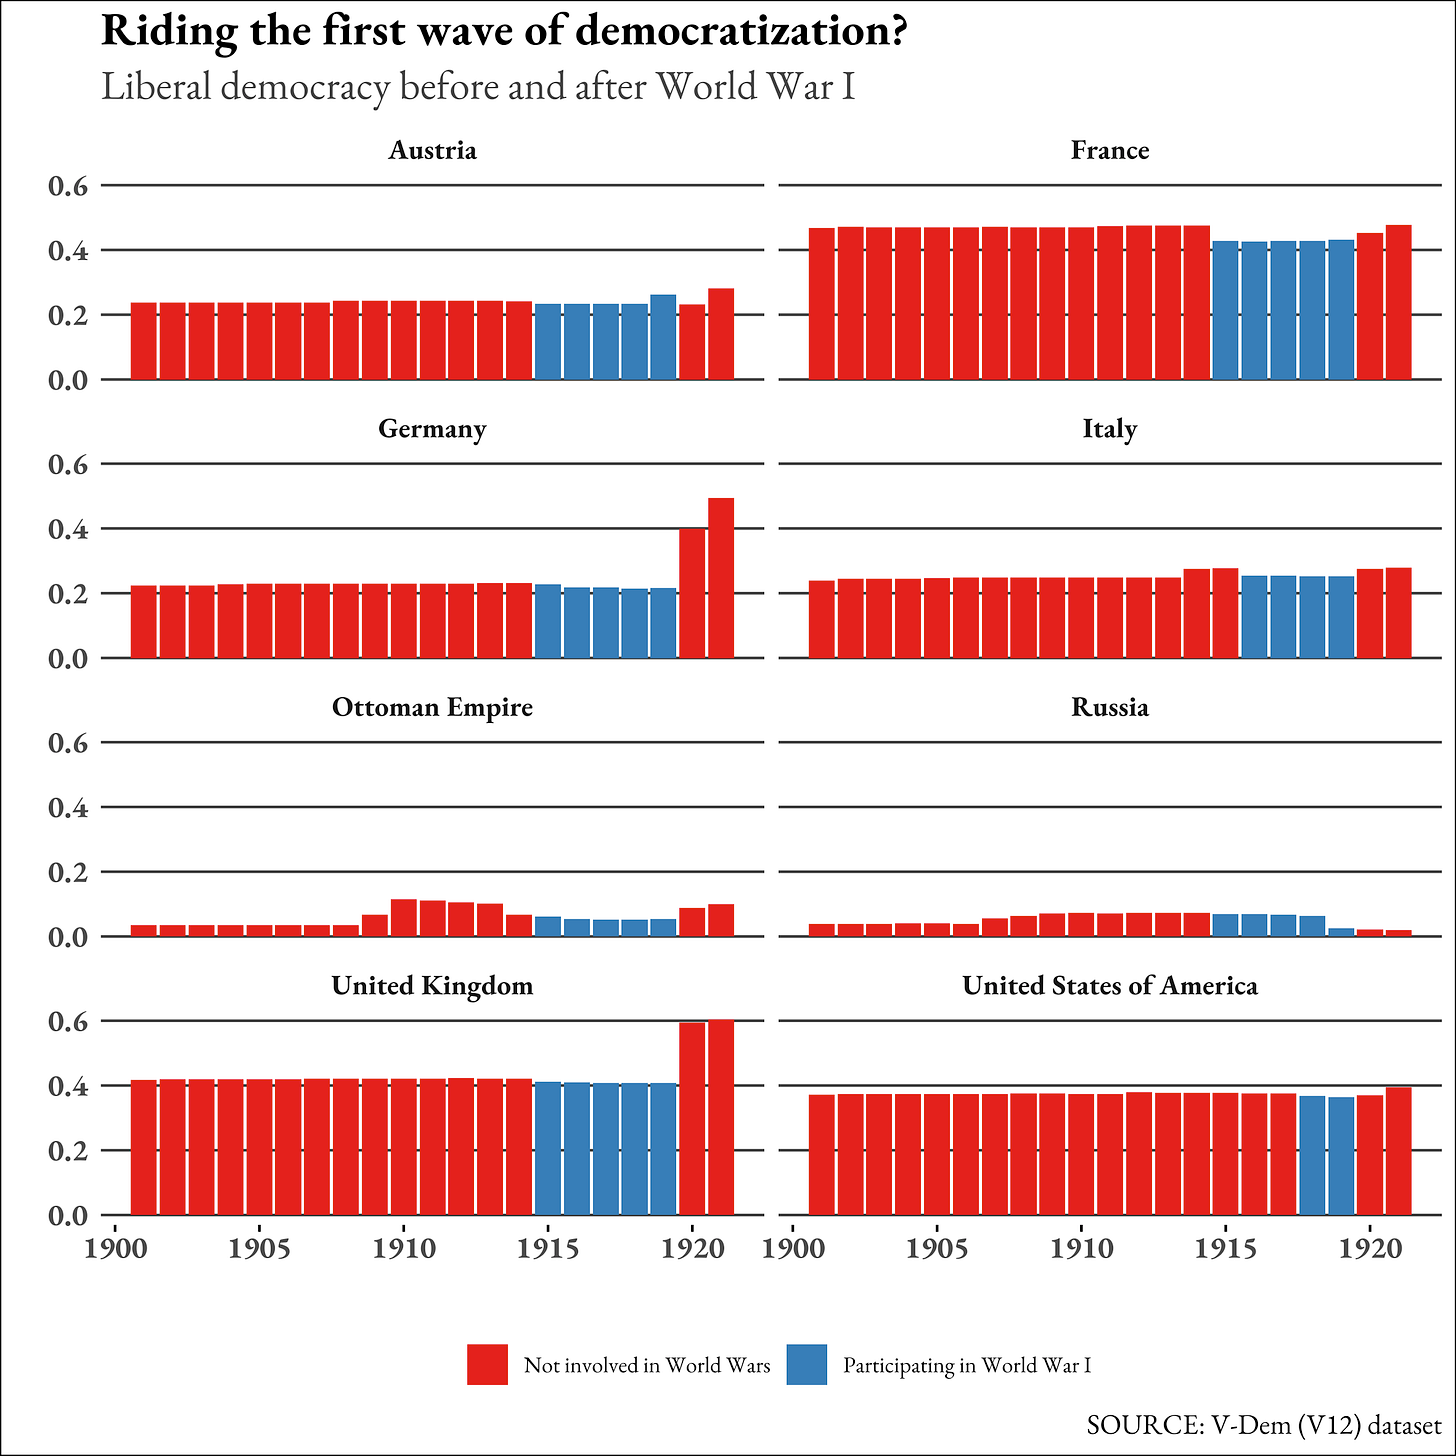
There is a political element so far neglected regarding the causes of World Wars. Some American historians, for example, point out that WWI was an ideological clash between democratizing countries like the U.S. or France against relics from the Ancien Régime like Germany, Austria, and the Ottoman Empire, even though Russia was fighting on the side of France. However, data collected via expert surveys by the V-Dem Institute tell a different story.
The above chart shows that Italy was not that far away from Germany when it came to democracy. Despite the U.S., France, and the U.K liberalizing their political systems, with today's eyes, it is complicated to consider them democracies in the modern sense. The Russian Empire looked like an uneasy outlier in the alliance against the Central Empires, showing that ideology was not the main factor for WWI. On the other hand, it was for World War II, as the following chart shows.
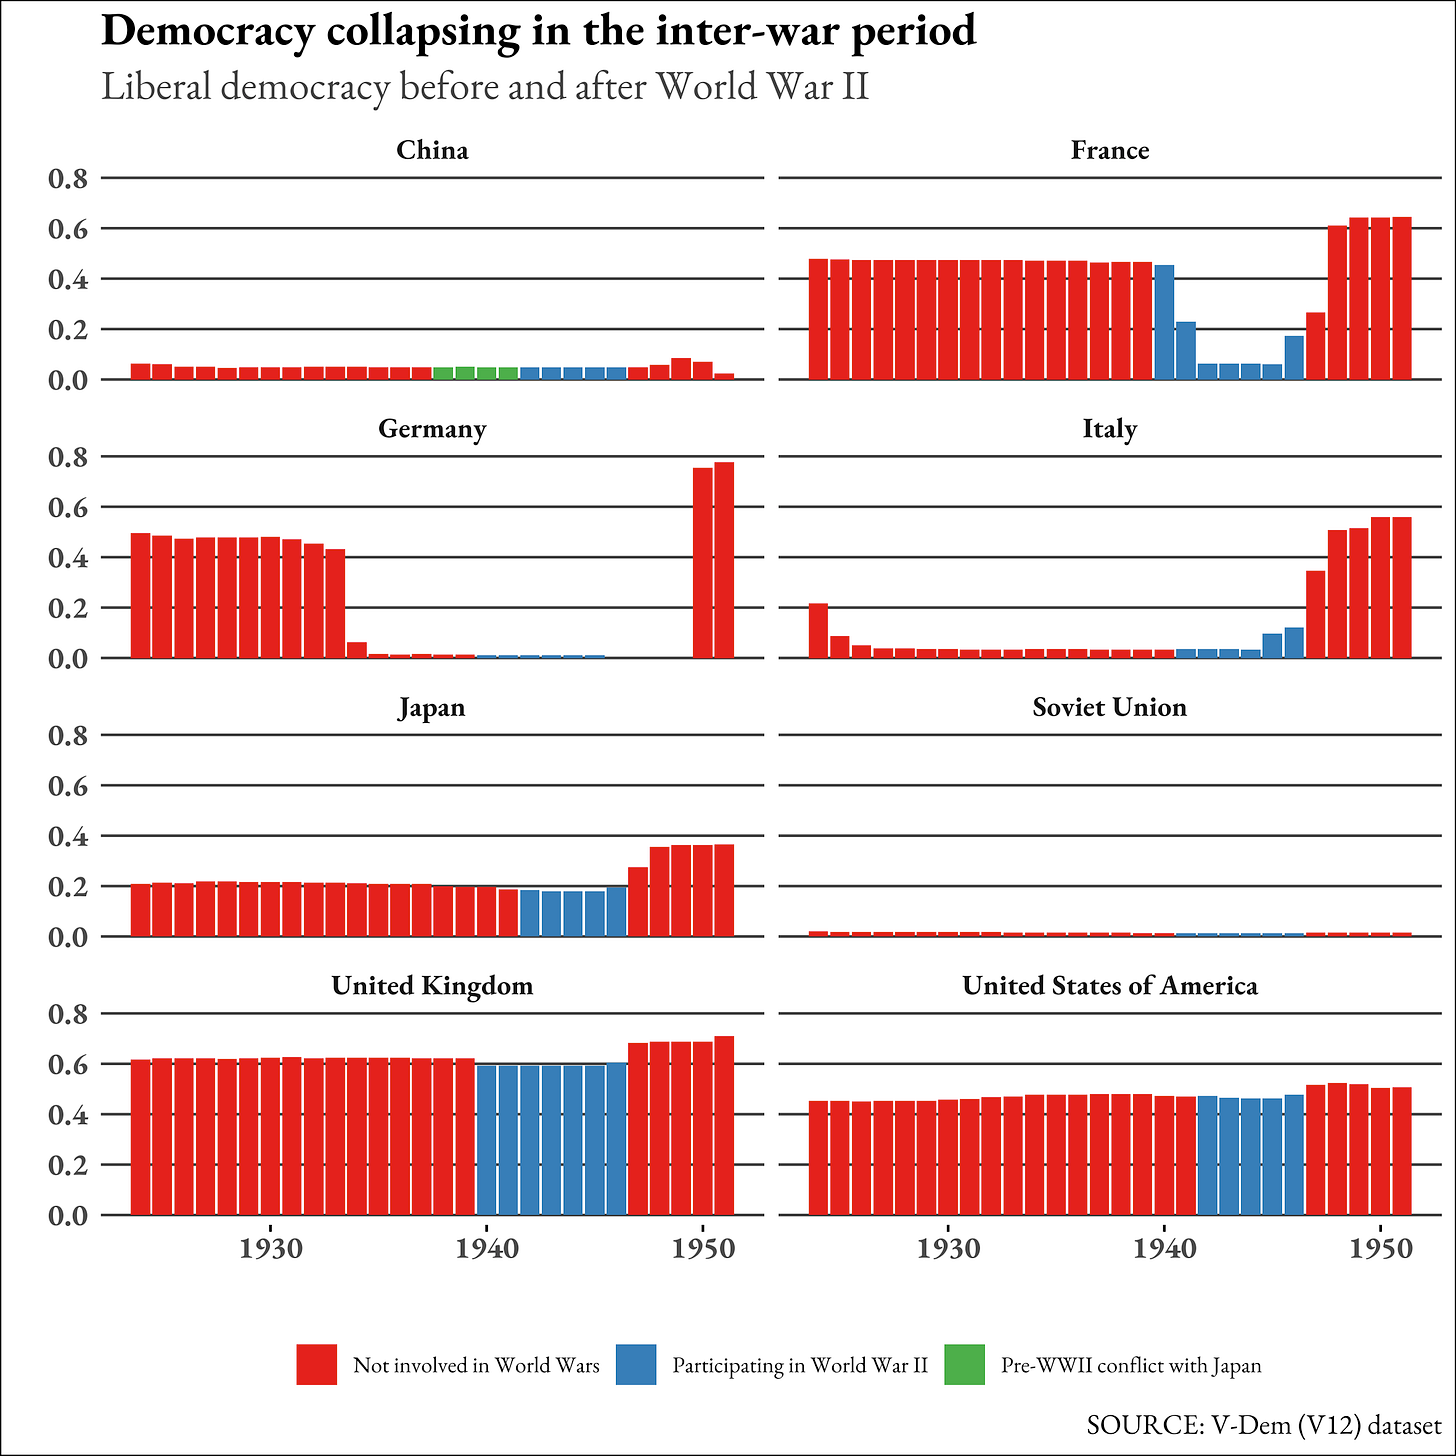
In the last chart, DaNumbers shows the soon-to-be U.N. Security Council members and the Axis powers. Except for China and USSR, it is hard not to see WWII as a clash between conservatory, reactionary powers and novel political regimes like Western democracies or even the Soviet Union. This is evident because, immediately after the conflict, most countries became more democratic. What some call the second wave of democratization starts here.
For the moment, DaNumbers tried to find if there was a recipe for world wars to start. There is no deterministic pathway to conflict. Yet, a few things emerge. First, there is a strong relationship between trade and the military. The U.S. naval strategy from the late XIX Century assessed that the U.S. Navy had to bring security to American trade routes globally. Secondly, ideology matters sometimes. During WWI, ideological cleavages were not that clear, but they became apparent in WWII. What can we make of these lessons? The following section will answer.
On the edge of the abyss?
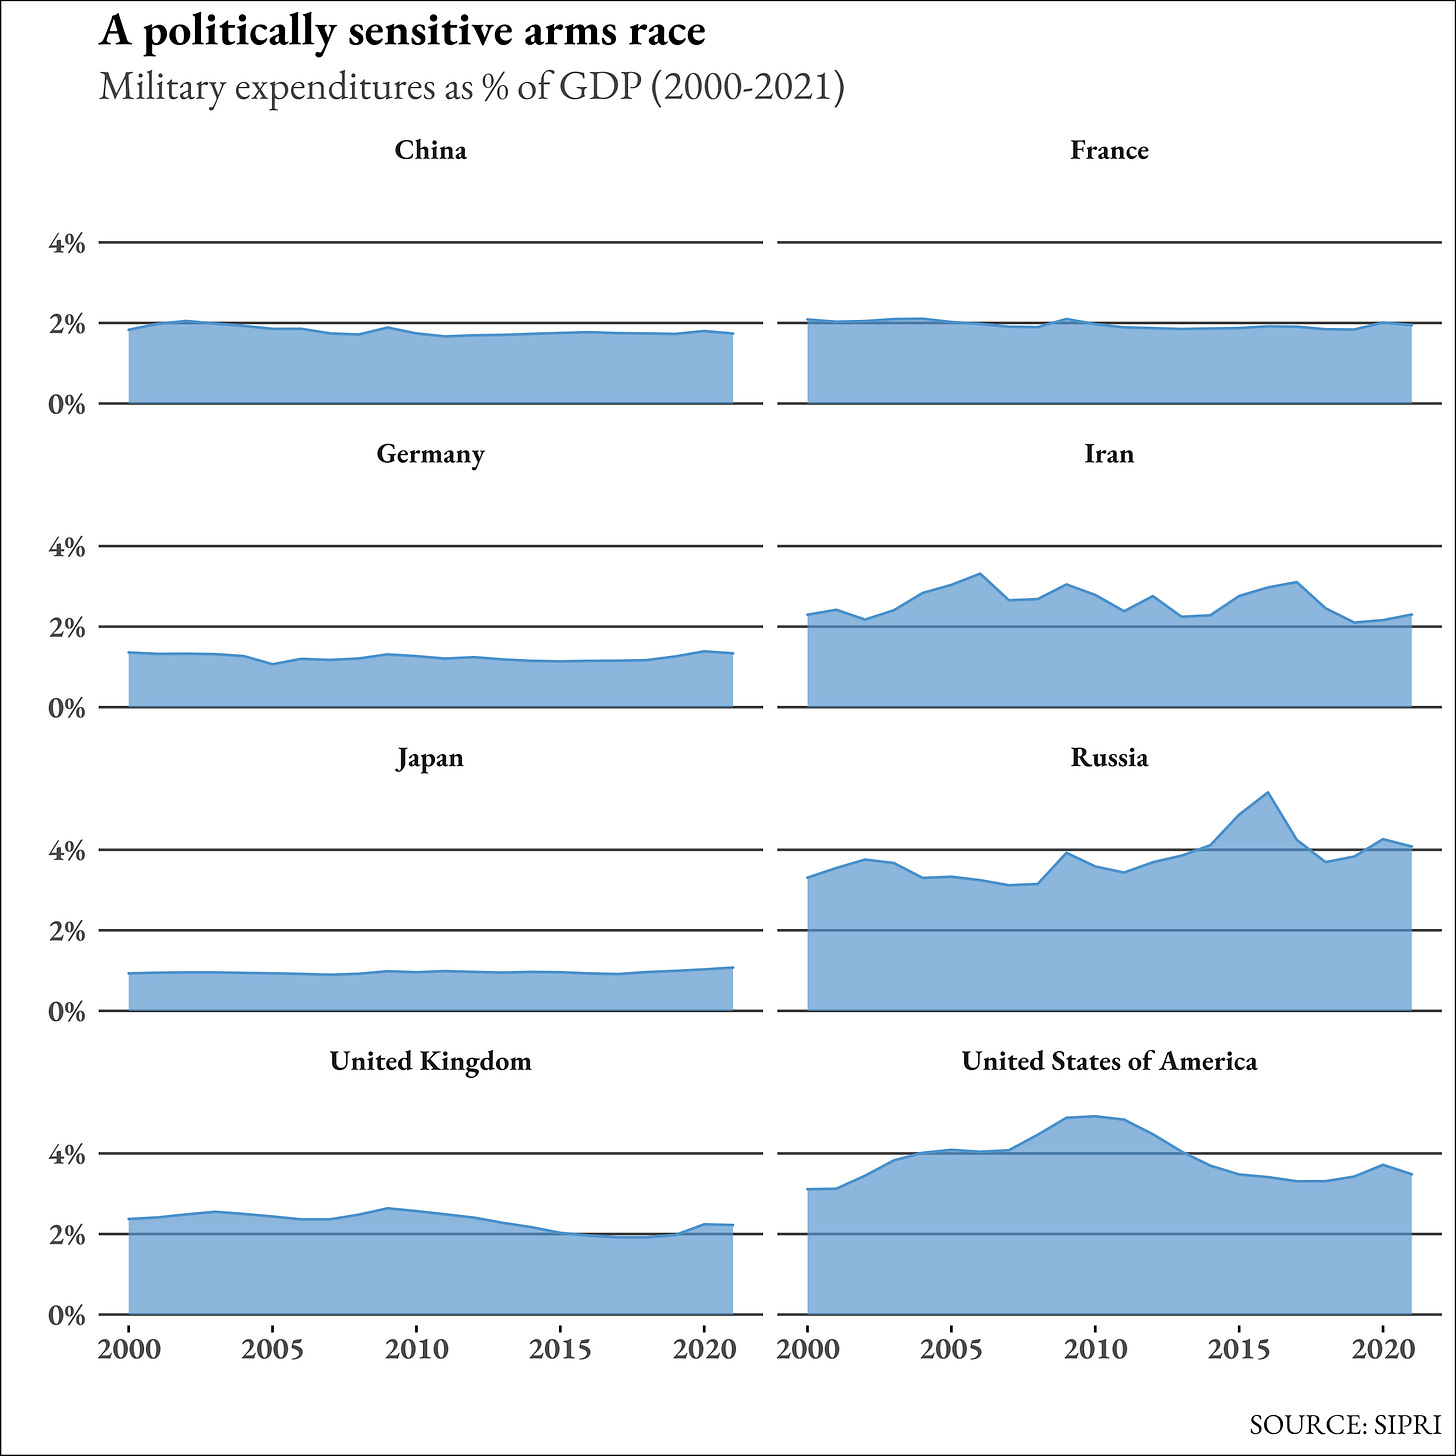
Data has become more available in the last 20 years. Thus, it is easy to see how bad the situation is. For example, thanks to the Stockholm-based SIPRI, we can assess the different defense budgets of world powers in GDP and absolute terms. The following chart is about military expenses as a share of the Gross Domestic Product, and it covers the world's major powers plus Germany and Japan. Germany and Japan are industrial powerhouses with pacifist constitutions. DaNumbers also added Iran because of its nuclear plans.
In 2021, only Russia devoted more than four percent of its GDP to defense. The United States was slightly above three percent. Germany and Japan have a long-standing policy of not spending more than one percent of the GDP on defense. Iran, on the other hand, remains around two percent like France and the U.K.
The conclusion of this chart is uneasy. Comparing this chart to the first of this story, someone could argue that the world is getting closer to a global confrontation: the major naval power, the U.S., is spending less than it should in terms of defense. Yet, it is not so easy: shifting the focus to the absolute defense expenses, it becomes clear that the U.S. still enjoys an asymmetry that is difficult to match for the other competitors, as the following chart will show.
Here, we see the evolution of global expenses between 2000 and 2021. The U.S. made its defense budget bigger after September 11, and, despite a slight reduction in the last years, it is still above 760 billion dollars. The Chinese case is more interesting: Beijing spent, in 2021, little more than 200 billion dollars in arms. What is interesting, though, is that its expenses follow an incremental path.
Twenty years ago, the Chinese GDP was 1.2 trillion dollars; in 2020, it was 14.7 trillion. The expense to GDP ratio is a fraction. Thus, by changing the denominator (GDP), the expense varies accordingly in absolute terms. The Chinese case is interesting because it allows the local leadership to claim that they are not changing their defense policy keeping the expenses/GDP ratio unaltered, yet pouring more and more money into arms.
Among other details, the above chart also shows why Russia is facing so many problems in Ukraine: it simply can't afford a large-scale invasion, thanks to a defense budget that is just as big as Great Britain's (around 60 billion dollars). The size of the American budget also shows the global asymmetry in favor of the U.S., with other countries all stuck with a defense budget of around 50 billion dollars.
Evidence that someone is playing the role of Germany before WWI, building a big navy and threatening the leading naval power, is ambivalent: looking at absolute values, it looks like President Xi is pretending to be the Kaiser. On the other hand, looking at the expense/GDP ratio seems like business as usual.
Even if China launched a new aircraft carrier recently, and even if it claims it wants to fill the gap with the U.S., for the moment, it has a defense budget that is less than one-half of its American counterpart.
Although there is still only one superpower, the political reality seems to be the most problematic of all. Even if defense budgets say otherwise, ideology could lead to a global confrontation. Comments to the following chart will help elaborate more on that.
Here we see the permanent members of the U.N. Security Council plus Germany, Italy, and Japan. What we see here is that there is, actually, a cleavage between democracies and autocracies. Some, including DaNumbers, framed the Russian invasion of Ukraine as a clash between autocracy and democracy as a theoretical construct.
Looking at the chart, though, we can spot slight declines in Western democracies. The crisis of representative democracies is a well-known subject. Yet, the drops in the Western world are not enough to shelf democracy as an ideal. By reading the three charts about the democracy/autocracy continuum, it looks like the question between liberal regimes and autocracies has never been as sharp as it is now.
Given how distant Western democracies are in terms of liberal democracy measurements from autocracies, we can see how polarised the world is. This is particularly dangerous because how democracies and dictatorships work directly affects how they operate on the international scene. Yet, there is still a safeguard that is preventing the world from spiraling into chaos: international trade. The following charts will show.
Here we see the last 20 years of trade among some of the biggest economies in the world. The flux of goods is always vis-à-vis the world. The chart above allows us to appreciate the American trade deficit. In 2021, the exchange value reached pre-COVID levels.
Moreover, trade has never been rich as it was in 2021: the U.S. exported goods for 1.75 trillion dollars. China exported for a value of 3.4 trillion dollars. Trade never looked so good for Germany, whereas Japan looks stable. These data are from 2021. Since the beginning of the year -- and even before the Russian invasion began -- there have been logistical issues in global supply chains. Yet, data suggest that international trade is not collapsing. The following chart offers some insights into that.
Here we see the value of goods moved by month since January 1, 2022. Imports and exports appear to run smoothly, without major changes. Despite the lack of data from China, information from other countries suggests that, so far, there is not a trade collapse that could lead to a global war between major powers.
For what it's worth
Despite conflicting data, it is not doomsday time just yet. DaNumbers didn't consider the number of nuclear warheads available. Also, we didn't consider inflation, given that charts on the matter are ubiquitous. What data say, though, is that something is happening here, but we do not have enough information to understand what it is.
Indications about the Chinese military budget are not enough to claim that Beijing is planning a global-scale conflict. Moreover, the naval supremacy of the United States is not debatable. The real question is: for how long?
For the moment, trade is holding, but Europe's lack of gas and other fossil fuels could make the scenario more volatile. The good news is that globalization (with the economic interests it implies) is not wholly going back. The bad news is that the decision to start a conflict is down to the ultimate deliberation by a restricted group of individuals. And there is not a dataset detailed enough to predict how this group of individuals will behave in the future.


