The COVID-related public debt surge explained
It is (not just) the pandemic (and you are not stupid).
Dear reader,
My name is Francesco Piccinelli Casagrande, and I am an Italian data journalist based in Brussels. Here I will brief you on current affairs using data. In DaNumbers #1, I will explain the dynamics of public debt in COVID times using data from the ECDC, the International Monetary Fund, and the World Bank. Here is what I found.
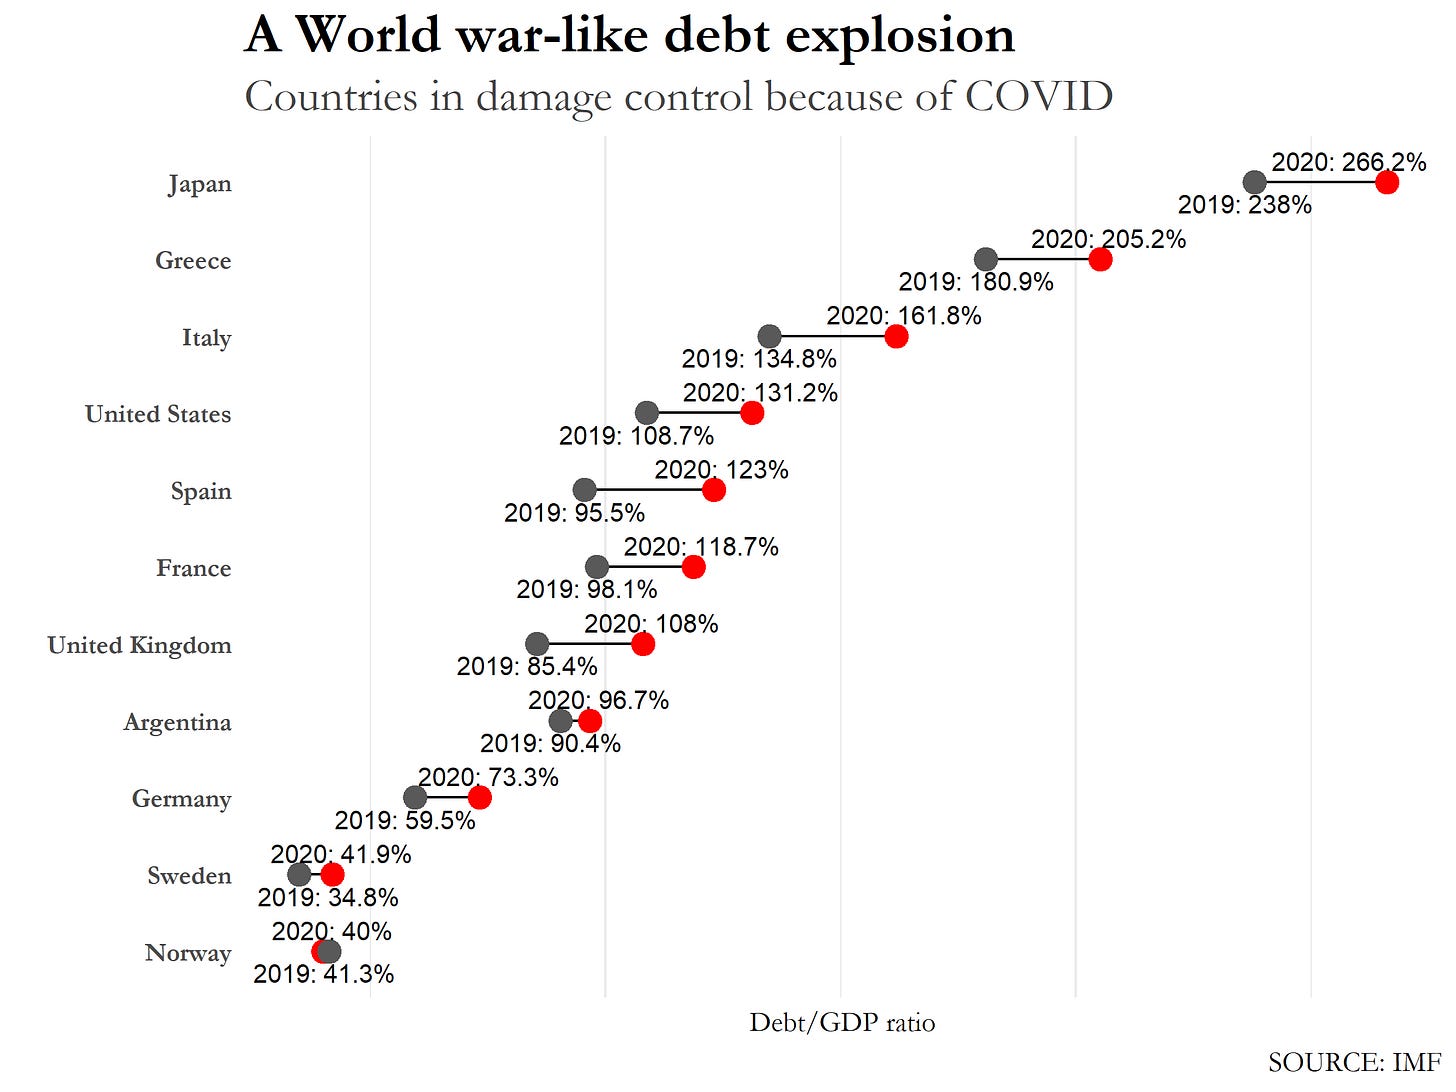
BRUSSELS - When it rains it pours, an analyst would argue reading into 2020’s public debt data from the IMF’s fiscal monitor. Relative to 2019, countries (on average) grew their debt by nine percentage points in terms of debt/GDP ratio, leading to an almost unprecedented situation.
Cherry-picking some countries, we notice that the growth of public debt was quite uniform among historically fiscally responsible countries like Germany or Sweden and countries like Japan or Greece. The only exception, in the chart, is Norway, which surprisingly reduced its debt from 41.3 per cent of GDP to 40.0 per cent.
Can we argue that the impact of COVID was uniform, irrespective of COVID cases? The answer is no. In facts, the following chart will show that COVID cases had an impact on how much debt countries piled up, relative to GDP.
Here, we see, on the x-axis, the number of COVID cases per million in 2020 and on the y-axis the percentage point difference in the debt to GDP ratio. The growing line is statistically significant: the more COVID cases, the more likely it is that debt surged. Yet, the chart has some hidden storylines worth being outlined.
The red line shows how, in a mathematically perfect world, the relation between COVID cases and debt would work. The grey shadow suggests where countries are most likely to sit.
Insular states like Seychelles or Maldives had to massively grow their stock of public debt relative to GDP irrespective of COVID cases impact. Countries with a diversified economy like France, Italy or Canada are above the line. Is there any other factor to take into account? Maybe yes.
The above chart can offer some hints about that missing factor. On the horizontal axis we see, relative to total trade, how positive or negative trade balances are.
On the left-hand side of the chart, we have countries like Liberia and Kiribati which might have problems asking for credit around global markets. On the far right, we have San Marino, Malta, Luxembourg or Singapore: small countries with an extra-positive trade balance.
What is interesting is in countries where the trade balance is at break-even. Those economies represent most of the G7, which implies that the most integrated economies suffered the most from the meltdown in global trade due to the pandemic. Yet, this is not enough.
Since 2008, public debt had been under the spotlight having crushed havoc on countries like Portugal, Spain, Greece and Italy. Also, already before the pandemic, Japan’s public debt became of legendary size. Does it have anything to do with the surge of public debt we experienced in 2020? The answer, according to the next chart, is yes.
Sudan, Italy, Greece, and Japan are firmly in the right-hand corner of the chart with Greece almost perfectly fitting the model. Others, like Belgium and Spain piled up more debt than expected (expectations being the red line in the middle of the chart), yet, the points in the plot suggest a growing trend: the more debt a country had in 2019, the more it collected debt in 2020.
Public debt has been an issue for much of the last decade: the Eurozone almost collapsed because of it in 2011. Yet, politicians and policymakers feel that public debt is the only way out of the COVID-caused economic meltdown. Will this massive amount of debt be the next threat to the global economy? Maybe, it is better to think about one emergency at a time.
Here is the code I used to write this story. If you are proficient with R you will find a couple of Easter Eggs that didn’t make it here (e.g. Is debt related to GDP growth? Well… run the code).
Thanks for your attention, and see you soon.
Francesco


